- Introduction
In the current emergency context, even the rural territory scientific components and governing bodies try to contribute to better understand the COVID-19 phenomenon and find post-emergency directions. In this framework, the National Observatory of Rural Landscape (ONPR) of the Agriculture Ministry and the CULTAB laboratory of the Florence University Agricultural School had the idea of carrying out a joint investigation about the Covid-29 contagions spread. The analysis has the aim to evaluate the virus spread in the different Italian rural areas, classified according to the intensity of agricultural activities, and try to identify the possible correlation between the infections and the different socio-economic development levels and thus the agriculture types.
It was adopted a different approach than the classification of contagion data by region evaluating the contagions number according to the rural development model. Moreover, the analysis has been done in a particularly important period because of the discussion on the new EU budget that has contributed to postpone the departure of the new EU agricultural policy (CAP), offering the possibility to redirect strategies and actions financed by the CAP in view of the post-emergency phase.
- Methodology
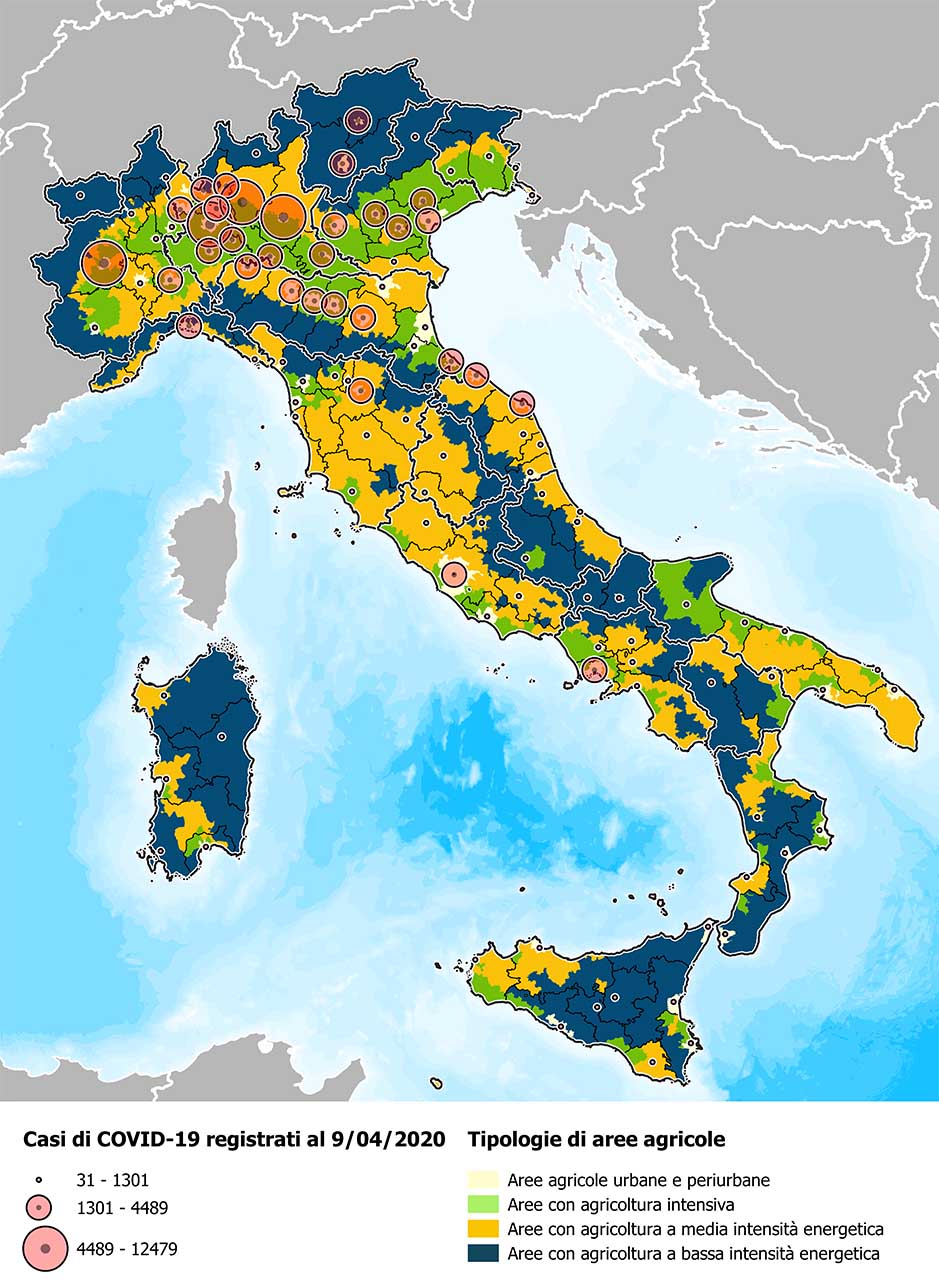
The first phase of the work required the classification of Italian agricultural areas according to the rural development model. These data can be extracted from the national rural development plan, developed by CULTLAB Laboratory, as the ONPR’s scientific secretariat, and accessible by the National Observatory of Rural Landscape. The Italian rural territory can be classified into 4 categories:
A) Urban and peri-urban agricultural areas. These are urban and peri-urban agricultural areas which include 195 Municipalities with a very high average population density (about 1,510 inhabitants / sq km). This category includes the regional capitals, most of the provincial capitals, the large metropolitan areas and any area with high population density. While covering only 4% of the national territory, they host 30.25% of the Italian population. Agriculture performs a production function equal to 12% of the national added value and covers neighbouring territories around large urban centres. In some areas, immediately behind the urban settlements, there is a concentration of industrial activities, including agro-food ones, which represent 31% of workers in the country’s agro-industrial industry. These features describe these territories as high intensity agricultural areas with important environmental impacts.
Total surface: 12.092 km2
Percent of national surface: 4%
Population: 18.270.106
Percent of the Italian population: 30,25%
Population density: 1510 inhab./sq km
Subdivision in land uses: urban 28%, agricultural 54%, forest 12%
B) Areas with intensive agriculture. Lowland areas with intensive agriculture, essentially located in the central-northern part of the country, which generally incorporate type A areas within them. Overall, these areas extend over 1,782 municipalities, which host just over a quarter of the total national population (26.83%) and which include the “central” part of the agro-industrial system. Compared to the 30% of the country’s agricultural workers and the 31% of agro-industrial workers, these areas produce the 38% of the national agricultural added value. These are densely populated areas (313 inhab./sq km), with a strong specialization in agriculture and agro-industrial activities. Like the type A areas, these too are high intensity agricultural areas with important environmental impacts.
Total surface: 51.702 km2
Percent of national surface: 17,11%
Population: 16.191.781
Percent of the Italian population: 26,83%
Population density: 313 inhab./sq km
Subdivision in land uses: urban 10%, agricultural 80%, forest 7%
TOTAL AREA A + B: 21% territory – 57% population
C) Areas with medium energy-intensity agriculture. Hilly and mountainous areas, mainly or significantly rural, which present a certain level of diversification of economic activities and are the site of widespread development. These areas also include a part of the rural north-central mountain, in particular the one most interested in the extra-agricultural development processes. Overall, there are 3,084 municipalities that represent 29.50% of the Italian population and about 33% of the territorial surface. In these areas the agricultural activity is complementary to others, but it constitutes one of the local economic system growth key in an integrated form. These areas produce 33% of the added value. There is a strong endowment of landscape, naturalistic, cultural, historical and gastronomic resources, which have been or are susceptible to enhancement in an integrated form, creating an integrated local economic system characterized by a balanced development of tertiary activities related to tourism, farm holidays, trade and specialized services. These are areas with less intensive agriculture than areas A and B
Total surface: 100.546 km2
Percent of national surface: 33,28%
Population: 17.803.210
Percent of the Italian population: 29,50%
Population density: 177 inhab./sq km
Subdivision in land uses: urban 5%, agricultural 62%, forest 29%
D) Areas with low energy-intensity agriculture. Mainly the mountain and the significantly rural southern hills, the mountain of the central-north with more marked characteristics of rurality and some areas of the southern plains and islands. These are the least populated areas of the country (59 inhab./sq km), characterized by abandonment phenomena during the last decades especially in the southern regions. While hosting the 13.41% of the population, they occupy the 45.6% of the territorial surface divided into 2,865 municipalities. In sectoral terms, these areas represent the 20% of the agricultural workers and the 17% of the added value (a percentage that rises to 21% in the convergence areas). The widespread presence of extensive agriculture and the abundance of forest resources, combined with the presence of the 68% of Italian protected areas, imply a strong value also from an environmental point of view, even if these are areas with severe development problems due to the abandonment effects, which would require a recovery for production purposes.
Total surface: 137.768 km2
Percent of national surface: 45,60%
Population: 8.094.449
Percent of the Italian population: 13,41%
Population density: 59 inhab./sq km
Subdivision in land uses: urban 2%, agricultural 34%, forest 54%
TOTAL AREA C + D: 78,8% territory – 35% population
- Results
The number of infections calculated to April 30 2020 have been merged into two areas types, combining the areas A + B (intensive agriculture) and C + D (non-intensive agriculture). Data show that in intensive agriculture areas are recorded 134 cases per 100km2, while in non-intensive agriculture areas 49 cases per 100km2. This situation is a pattern that, with different intensities, repeat itself from the north to the south of the country in the same types of areas. The national territory registers 67 cases per 100 km2 on average.
Considering the Po Valley alone, the most severely affected area, where the 61% of the intensive agriculture areas and the 70% of the Italian cases of Covid-19 are concentrated, 197 cases are recorded every 100km 2 in the intensive areas and 130 cases every 100km2 in the non-intensive.
| Italy | Number of cases every 100 sq. km |
| Avg national | 67 cases every 100 sq. km |
| Intensive agricultural areas (A + B) | 134 cases every 100 sq. km |
| Non-intensive agricultural areas (C + D) | 49 cases every 100 sq. km |
| Po Valley | Number of cases every 100 sq. km |
| Avg Po valley | 160 cases every 100 sq. km |
| Intensive agricultural areas (A + B) | 197 cases every 100 sq. km |
| Non-intensive agricultural areas (C + D) | 130 cases every 100 sq. km |
Notes about demography
Regarding the different distribution of population in these areas, it is possible to analyse the cases of COVID-19 not based on the surfaces (km2) of rural areas, but on the contagion incidence on the population, in other words how many cases of COVID-19 have actually been detected per 10,000 inhabitants in different areas.
Incidence of infection (number of reported cases / 10,000 inhabitants)
National level: 34 cases / 10,000 inhabitants
Intensive agriculture areas: 37 cases / 10,000 inhabitants
Non-intensive agriculture areas: 28 cases / 10,000 inhabitants
The data show that in areas where agriculture activities are based on intensive systems the incidence of contagion is higher, while in areas with non-intensive agriculture the incidence is less high, with fewer cases per 10,000 inhabitants. It must be said that the demographic data presented in this way (cases x 10,000 inhabitants) do not consider the possible difference in the number of cases between citizens residing in the urban area and citizens residing in the countryside. This is a difference that, if detectable, would be probably significant.
- Consideration for the post-emergency
Low energy intensity agricultural areas seem safer for the virus spread. The measures for the post-emergency recovery should be different from the rest of the territory, this also considering the difference between north and south, since in the south there are far fewer cases.
Compared to the trend recorded in recent decades, which has seen a progressive abandonment of hilly and mountainous rural areas (-10 million ha of areas cultivated since the post-war period) and a progressive concentration of urban settlements, infrastructures, population, industry and agro-industry in a few lowland areas, we probably should start to think of reducing, if not reversing, this trend. This for a number of reasons ranging from environmental and public health factors, to economic reasons that concern, among other things, the impossibility of applying industrial agricultural models in hilly and mountain areas, for which is necessary a different development strategy to avoid further abandonment. If limiting the “density” at territorial and socio-economic level could be a strategy, also in view of future epidemics, certainly adequate infrastructures and services in rural areas, including broadband, should be priority choices to improve and promote the quality of life.
The new EU agricultural policy is an opportunity to enhance areas that have a strong endowment of landscape, naturalistic, cultural, historical and food and wine resources through targeted economic incentives, creating an integrated local economic system characterized by a balanced development of tertiary activities related to tourism, agritourist, trade and specialized services.


